Free tool

How healthy is your engineering team?

12 questions for an initial view of how your team works across 6 dimensions.

Examine the team’s practices and difficulties.

How to read your results

Understanding your assessment.

Priority areas

The six dimensions of your team

Knowledge sharing

Your answers suggest that knowledge is concentrated in a few people. Check what the team would be unable to deliver in their absence.

A first action — Introduce pair programming on critical paths and document architecture decisions.

The diagnosis can help examine how knowledge is shared within the team.

Velocity

The delays you report suggest looking at where work waits: reviews, decisions or dependencies.

A first action — Identify the main bottleneck (reviews, process, dependencies) and eliminate it first.

Let’s look at where delivery gets stuck and who can unblock it.

Quality

Your answers point to difficulties with production releases. Review recent incidents, tests and release practices with the team.

A first action — Establish a systematic review process and invest in tests on critical paths.

A focused engagement can help make releases safer.

Autonomy

The approvals and dependencies you report seem to limit autonomy. Ask the team which ones delay delivery.

A first action — Reduce approval gates and give individual developers more ownership.

A fractional CTO can help distribute decisions and responsibilities.

Scalability

Your answers suggest preparing for new hires: onboarding time, knowledge sharing and the availability of those supporting newcomers.

A first action — Standardize the onboarding process and reduce reliance on a few key people through knowledge sharing.

A fractional CTO can help distribute decisions and responsibilities.

Morale

Morale, departures or meeting load stand out in your answers. Discuss them with the team to understand what is causing strain.

A first action — Reduce meeting load, listen to team frustrations, and act on turnover.

We can review workload, responsibilities and working conditions together.

3 steps · 12 questions

Take your team’s pulse.

Team structure

Start with your current situation. An estimate is enough.

Velocity and quality

Start with your current situation. An estimate is enough.

Culture and autonomy

Start with your current situation. An estimate is enough.

Calculated in this browser. If you share the result, its link contains your answers.

Method

How to assess the health of a development team.

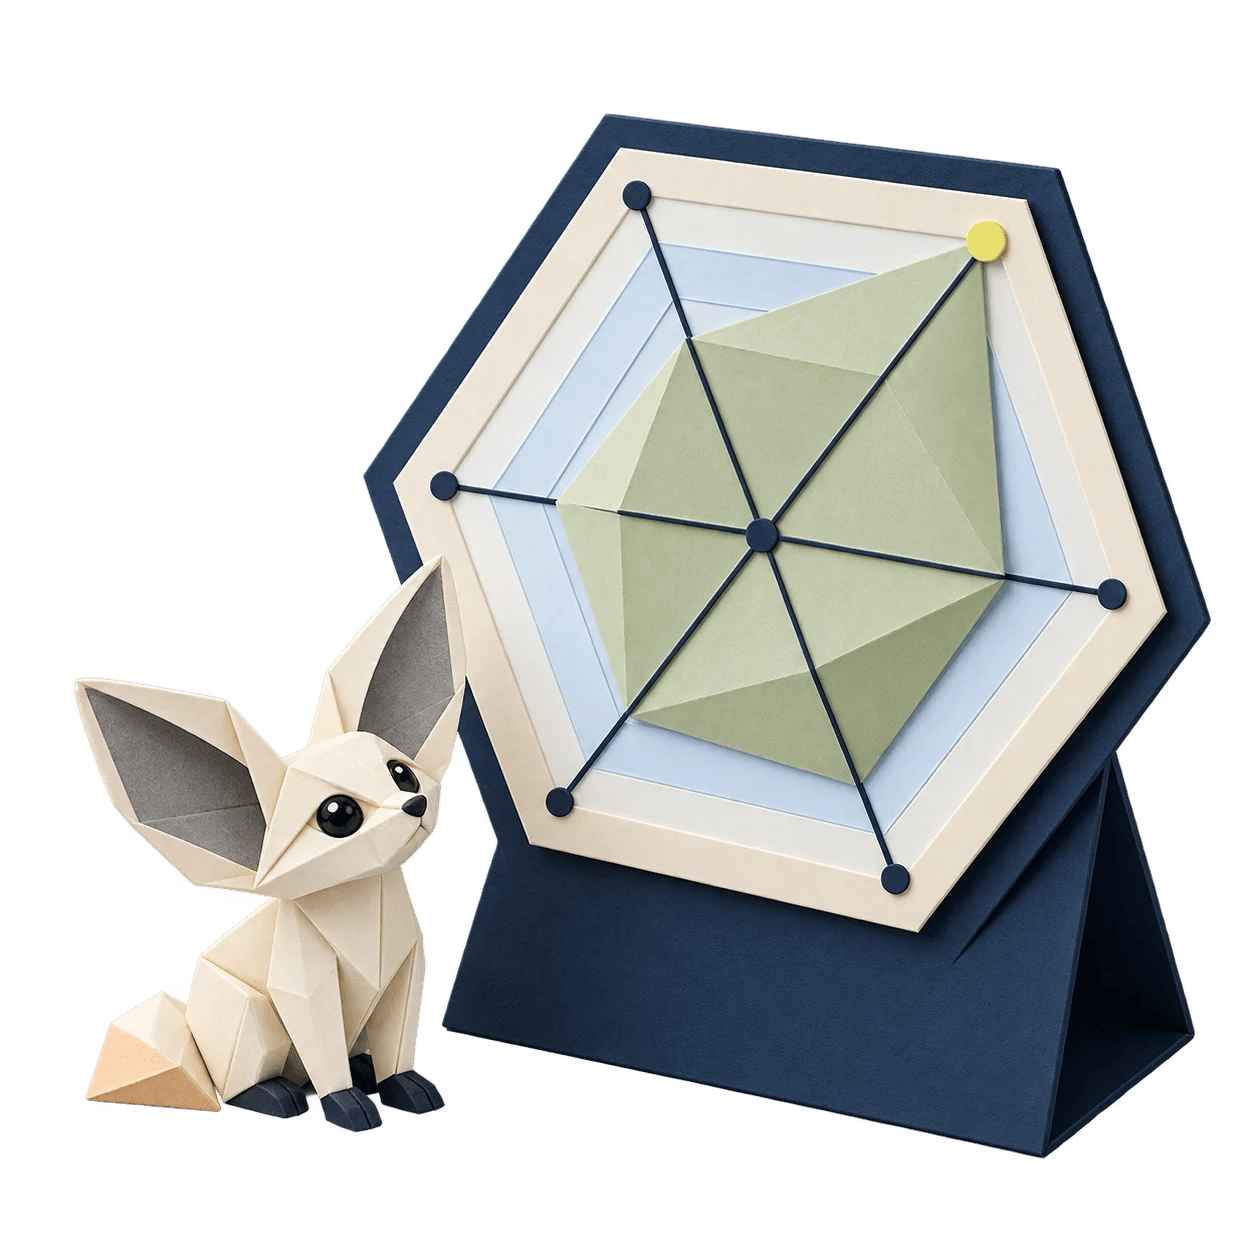
The radar asks twelve questions about things you can observe, not about anyone’s worth. Each answer scores 100, 66, 33 or 0 points, except team size, which scores 50, 70, 90 or 100. The answers combine into six dimensions, and the average of the six gives the overall score. Here is what each dimension looks at, what triggers an alert and how to read the most telling radar shapes.

The six dimensions and their indicators

Each dimension combines two or three indicators. Review time, for example, is more useful when considered alongside release incidents. The percentages show the weight of each indicator within its dimension.

The question “how many departures would put the project at risk?” concerns the bus factor: the smallest number of departures that would remove knowledge essential to the project. The lower that number, the more the team needs to discuss that dependency.

  • Knowledge sharing: indispensable people (60%) and the time a new developer needs to ship a first meaningful contribution (40%).
  • Velocity: the time from ticket to production (40%), deployment frequency (30%) and pull request review time (30%).
  • Quality: how often deployments cause incidents (40%), the time to restore service after a failed deployment (30%) and review time (30%).
  • Autonomy: whether a developer can ship a standard feature without waiting on anyone (70%) and the share of time spent in meetings (30%).
  • Scalability: onboarding time (50%), indispensable people (30%) and team size (20%), since a small team has less slack to absorb an arrival or a departure.
  • Morale: perceived morale (40%), voluntary departures over the last twelve months (40%) and meeting load (20%).

The thresholds that trigger an alert

Each dimension is the weighted average of its indicators, rounded to the nearest whole number. The overall score is the average of the six dimensions, and it places the team in one of the four levels below.

The report always highlights the two lowest dimensions as priority areas, even when the overall score is good. This ranking starts the discussion; it does not establish on its own that action is needed. Some answers cap a dimension: one indispensable person limits knowledge sharing to 40, and delivery depending on one key person limits autonomy to 30.

When two people answer, the report compares their readings: the gap on a dimension is the difference between their two scores, from 0 to 100. The gaps are ranked from largest to smallest, and the first two are highlighted, because they deserve a conversation before any action.

  • 80 to 100, “Thriving”: the team ships, shares and copes with the load. The challenge is to stay that way while growing.
  • 60 to 79, “Solid”: the foundations hold, and one or two dimensions need targeted action.
  • 40 to 59, “Fragile”: several signals reinforce each other. Left alone, delivery slows down and departures become more likely.
  • Below 40, “Critical”: the team is in survival mode. The priority is to secure key people and the release process.

How the radar relates to DORA metrics

DORA (DevOps Research and Assessment) is the research program behind the annual Accelerate State of DevOps report. Its software delivery metrics are widely used to measure a development team’s performance. The radar covers the four original metrics, in a form a business leader can answer without tooling.

The answers to the deployment frequency and recovery time questions follow the levels of the 2024 report: the highest performers deploy on demand, several times a day, and recover in less than an hour; the lowest performers deploy between once a month and once every six months, and take between a week and a month to recover.

DORA now tracks five metrics, adding the share of unplanned deployments caused by a production incident. It stresses that they apply to an application or a service, and that they are not meant to make teams compete. The radar follows the same principle: it describes a way of working, not individual performance.

  • Deployment frequency: how many times the team deploys to production over a period. The radar asks it directly and counts it in velocity.
  • Change lead time: DORA measures it from commit to deployment. The radar asks for the time from ticket to production, which is broader because it includes the wait before development starts, the part a business leader sees.
  • Change fail rate: the share of deployments that require immediate intervention. The radar asks how often a deployment causes an incident.
  • Failed deployment recovery time: how long it takes to restore service. The radar asks it directly and counts it in quality.

Sources

Three typical profiles to recognize on the radar

These profiles illustrate possible combinations of questionnaire answers. They can help you choose what to ask the team.

  • The team that relies on a hero: velocity and quality hold up, sometimes very well, but knowledge sharing, scalability and often autonomy are hollowed out. One indispensable person, long onboarding, releases that go through them. First action: spread their knowledge before handing them more.
  • The team held up by approvals: autonomy and velocity are low, while quality remains reasonable. Several approvals per feature, reviews waiting for days, many meetings. The code is clean but slow to arrive. First step: examine what each approval protects, remove a redundant step if the control is still covered and agree on a review deadline.
  • The team under strain: morale is low, with a heavy meeting load and recent departures, while velocity and quality remain good. Steady delivery can hide these difficulties. First action: listen to the team, reduce meetings and examine why people have left.

Why a development team slows down

When delivery slows down, examine how work moves through the team: waiting time, approvals and dependencies may explain some of the delays.

Each of the causes below leaves a trace in the radar’s answers. The radar does not say which one dominates in your case, but it shows where to look first.

  • Work waits: reviews that take days, approvals in series, one key person everything goes through. Development time barely changes, waiting time grows.
  • Releases are scary: the team deploys less often, batches changes together, and every release gets heavier and riskier.
  • Technical debt piles up: every change touches fragile code, and incidents eat the time planned for the roadmap. The technical debt calculator estimates its cost.
  • Knowledge is concentrated: newcomers take weeks to contribute, and the longest-serving developers spend their time answering questions.
  • Meetings eat into building time: from 40% of time in meetings, the answer is worth only 33 points out of 100, and 0 beyond 60%, for autonomy and morale alike.
  • The team is wearing out: every departure takes knowledge with it and restarts an onboarding, which weighs on those who stay.

Team health radar: your questions.

  • Who should fill in the radar?

    A business leader can fill it in alone, with what they see from where they sit. The lead developer or engineering manager will answer the delivery questions more precisely: reviews, deployments, incidents. Ideally, you both fill it in separately, then compare your radars: the gaps between your two readings are as telling as the scores.

  • How do I compare my reading with my team’s?

    Once your result is shown, the “Ask my team to answer” button copies a link to send to your lead developer or to someone on the team. They answer the same twelve questions without the page showing them your answers, then see your two radars overlaid, the gaps by dimension and the two largest ones to discuss first. They can send you back a link that opens the comparison directly. As with sharing, the answers travel in the link itself, with no storage: anyone holding it can read them, and the page simply does not show them before the reply.

  • Does the score replace a team audit?

    No. The radar relies on twelve self-reported answers: it shows where to look, not why the situation took hold. An audit cross-checks interviews, the code, the backlog, incidents and rituals. That is what I do in the Tech & Organization Diagnosis: 5 days, €3,000 excl. VAT, with a risk map and a 30, 60 and 90-day action plan.

  • Are my answers stored?

    No. The calculation runs in your browser: your answers are neither stored nor sent, to me or to any server. If you share the result by link, the answers are encoded in the address itself, with no storage: only people who have the link can read them. The site’s audience measurement never receives your answers.

  • What should I do with a fragile score?

    A score between 40 and 59 points to several weaknesses that reinforce each other. Start with the two priority areas in the report and the first action suggested for each, without trying to fix everything at once. Run the radar again two or three months later, with the same people answering, to see whether the dimensions move. If you cannot tell where the fragility comes from, or if it spans several dimensions, an outside view saves time: that is what the 5-day diagnosis is for.

Need help strengthening your team?

Your answers start a conversation. The situations the team has in mind matter at least as much as the scores.

Latest articles

Blog